Using Engagement Data
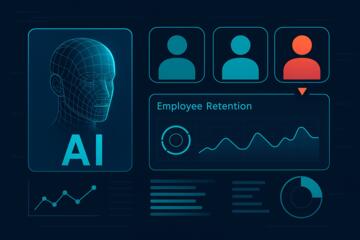
Employee engagement data turns opinions and behaviors into measurable signals that leaders can compare over time. The goal is not to “score” people; it is to identify patterns that predict outcomes like turnover risk, absenteeism trends, or customer-impacting delays. A practical starting point uses two data streams: periodic employee surveys and operational traces such as ticket cycle time, shift coverage, or training completion. When these streams align, managers can test targeted changes instead of relying on anecdotes.
For example, a survey item like “I can get help when I need it” often correlates with support responsiveness metrics. If the help desk average first-response time rises while the survey score drops, the organization has a concrete hypothesis to investigate. In one mid-sized operations team, the pattern appeared after a staffing change; the fix involved adjusting escalation rules and training the on-call rotation, not adding more meetings. The same approach works for remote teams, where engagement signals show up in meeting load, collaboration latency, and onboarding progress.
Data insights also help you separate “engagement” from adjacent constructs. Engagement surveys may capture motivation, while HR systems capture tenure and leave. If you treat all of them as the same thing, you end up chasing noise. A careful analysis keeps definitions consistent and documents what each metric can and cannot claim.
Common Measurement Pitfalls
Teams often get misled by measurement choices and by the dependencies behind the numbers. One frequent issue is mixing engagement survey results with performance ratings without accounting for different purposes and biases. Survey responses reflect perceptions and context; performance ratings reflect outcomes and manager judgment. Combining them into a single “engagement score” can create circular reasoning and unfair comparisons.
Another pitfall involves sampling and timing. If you run a survey right after a reorganization, the results may reflect uncertainty rather than stable engagement drivers. If participation rates differ across departments, the averages can shift because of who responded, not because conditions changed. Many organizations also forget that engagement is influenced by workload, staffing, and process design, which sit outside HR’s control.
Supporting technologies shape what you can measure. HRIS systems track employment events and leave; learning platforms track training completion; collaboration tools track meeting frequency and message volume. These tools do not measure engagement directly, and they can misrepresent behavior when people change communication channels. For instance, a team that moves from meetings to async updates may look “less active” in calendar data while engagement improves.
Privacy and labor law constraints also affect what you can collect and how you can interpret it. In the European Union, the GDPR requires a lawful basis, data minimization, and transparency for employee monitoring. In the United States, state privacy laws and sector rules can apply, and union or works council agreements may restrict monitoring practices. Even where monitoring is legal, using it to infer individual traits can raise ethical and compliance risks.
Finally, dashboards can hide uncertainty. A trend line that looks smooth may come from small sample sizes or from a single outlier team. If you do not track confidence intervals or at least set minimum response thresholds, you will act on patterns that do not generalize.
Data-Driven Action Steps
Build a Simple Insight Loop
Start with a repeatable cycle: define a question, collect data, analyze patterns, test an action, then measure again. Keep the first cycle small so you can attribute changes to a specific intervention. A common cadence uses a monthly operational metric review and a quarterly pulse survey. In practice, teams often run into survey fatigue, so a short pulse with 6–10 items can work better than a long annual questionnaire.
Document the mapping between survey items and operational signals. For example, “clarity of priorities” can map to sprint goal completion rates or backlog aging. “Manager support” can map to onboarding check-in completion and time-to-escalation. This mapping prevents the “dashboard hunting” problem where leaders chase whatever metric moved last week.
One small aside from implementation work: I have seen teams use a lightweight template in Notion or Confluence to record hypotheses and expected direction of change. Versioning matters; when the template changes mid-quarter, you lose comparability. A simple “v1.2” change log for the survey items can prevent silent drift.
Choose Metrics With Limits
Use metrics that reflect mechanisms, not just outcomes. Engagement surveys can indicate perceptions, but operational metrics can indicate friction. Pair them. If you only track survey sentiment, you may miss process bottlenecks. If you only track operational throughput, you may miss burnout signals.
Set guardrails for interpretation. Require a minimum number of responses per team before you compare results. Track participation rate alongside engagement scores. When you analyze operational data, separate normal seasonality from change events like policy updates or staffing shifts.
Realistic outcomes depend on baseline and intervention type. A targeted process fix can improve a related operational metric within 4–8 weeks, while survey items may take 1–2 survey cycles to shift. If you expect a large engagement jump after a single training session, the data will disappoint, and the team will lose trust.
Test Changes Without Guessing
Run small experiments when possible. For example, if “I receive timely feedback” scores low, test a structured feedback cadence in one unit before rolling it out. Measure both the survey item and a proxy like review turnaround time. Use a control group when you can, or at least compare to a similar team that does not receive the change during the same period.
Keep the intervention narrow enough to attribute effects. If you change scheduling, training, and tooling at once, you cannot tell which lever mattered. Teams often underestimate this; they treat engagement initiatives like broad programs rather than testable changes.
When you use analytics tools, track the query logic and data refresh schedule. A minor aside: I have seen a Power BI report updated on a different day than the HRIS extract, which created a misleading “drop” that was just a timing mismatch. A one-line note in the report metadata about refresh time can save hours of debate.
Communicate Results and Tradeoffs
Share insights in a way that respects confidentiality. Publish aggregated results at a team or site level, not individual-level dashboards. Explain what the data can show and what it cannot. If you plan to use operational monitoring, disclose the purpose, retention period, and how you avoid using it to evaluate individuals.
Communication also affects engagement. If employees see only “scores” without actions, they learn that feedback has no impact. A practical approach uses a short “what we heard, what we changed, what we will measure next” update after each survey cycle. People notice when the organization closes the loop, even if the changes are modest.
Where legal constraints apply, involve HR compliance and, when relevant, works councils or unions. In the EU, GDPR transparency and purpose limitation matter, and in unionized environments, monitoring practices can require consultation. The safest path is to align data use with documented policies before collecting new signals.
Educational Case Examples
Support Team: Help-Seeking Friction
A customer support team ran a quarterly pulse survey in March 2026 and found lower scores on “I can get help quickly.” At the same time, operational data showed first-response time increased from 18 minutes to 26 minutes over six weeks. The team also observed a higher rate of escalations that bypassed the standard knowledge base.
The manager tested a two-week change in one sub-team: escalation prompts in the ticketing tool and a short refresher on the knowledge base articles. After the test, first-response time returned to 19–21 minutes, and the survey item improved in the next pulse by a small margin. The organization did not claim a causal miracle; it treated the improvement as a hypothesis supported by aligned signals and then monitored for persistence.
Manufacturing: Onboarding and Shift Coverage
A manufacturing site saw rising early-tenure attrition and lower engagement scores on “I understand how my work fits the process.” HRIS data showed that new hires completed safety and role training on time, but line supervisors reported inconsistent shift coverage during the first month. Operationally, training shadowing hours varied widely by shift.
The site introduced a scheduling rule that reserved a fixed shadowing block for new hires and tracked completion by shift. Engagement scores improved modestly in the next survey cycle, while absenteeism did not spike. The site still faced constraints from production demand, so it tracked whether the change reduced overtime for trainers, which can indirectly affect engagement.
Engagement Metrics Checklist
| Decision You Need | Data to Check | What It Can Tell You | What It Cannot Tell You |
|---|---|---|---|
| Where engagement is slipping | Pulse survey trends + participation rate | Perception changes over time | Individual intent or hidden causes |
| What friction drives it | Operational proxies (cycle time, escalation rate) | Process bottlenecks and delays | Whether people feel supported |
| Whether actions worked | Pre/post comparisons with minimum sample rules | Direction and persistence of change | Perfect causality without controls |
| How to act responsibly | Data governance, retention, transparency notes | Compliance alignment and risk reduction | A safe shortcut around policy |
Step-by-step checklist for a first cycle:
- Pick one engagement theme (example: feedback timing) and define the survey item wording.
- Set a minimum response threshold per team and track participation rate every cycle.
- Select one operational proxy tied to the theme and document the data source and refresh date.
- Choose one intervention with a narrow scope and a clear expected direction of change.
- Measure again after 4–8 weeks for operational signals and after the next survey cycle for perceptions.
- Share aggregated results and the specific action taken, then record what you will test next.
Common Mistakes to Avoid
One mistake involves treating engagement as a single number. Engagement themes include clarity, support, fairness, workload, and growth. If you compress them into one metric, you lose the mechanism that guides action. A team might show stable overall engagement while one theme worsens, and the organization misses the early warning.
Another mistake is using individual-level analytics to infer attitudes. Even when data is technically available, it can create fear and reduce response rates. Aggregation and transparency matter, and employees should understand what is measured and why. When employees suspect hidden monitoring, survey participation drops, which then harms the quality of insights.
Teams also overfit to short-term changes. A single month of operational data can swing due to holidays, system outages, or staffing gaps. If you do not track context, you may blame leadership decisions that did not cause the change. A short “events log” alongside dashboards helps interpret anomalies.
Finally, organizations sometimes write action plans that sound good but do not connect to the data. Promotional writing appears when leaders promise outcomes without stating what metric will move and when. A trustworthy plan names the hypothesis, the proxy metric, and the measurement window, even if the expected effect is modest.
FAQ
What engagement metrics work best?
Use a small set of survey items tied to specific themes, then pair each theme with one operational proxy that reflects friction. Track participation rate and minimum sample sizes so comparisons stay meaningful.
How often should we run employee surveys?
Many teams use quarterly surveys for deeper items and monthly or bi-monthly pulses for a few questions. The right cadence depends on response burden and how quickly you can act on findings.
Can operational data replace surveys?
Operational data can signal workload and process delays, but it does not measure perceptions like support or fairness. Pairing operational proxies with survey items usually produces more actionable insights.
How do we protect privacy when analyzing engagement?
Aggregate results at a team or site level, document lawful basis and retention, and avoid using monitoring data to infer personal traits. In GDPR contexts, transparency and data minimization are central requirements.
How do we prove an action improved engagement?
Use pre/post comparisons with minimum sample rules and measure both operational proxies and the related survey item. When possible, include a control group or staggered rollout to reduce confounding.
Author's Insight
Engagement programs succeed when they treat data as a hypothesis generator, not a verdict. Survey results need context like participation rates, timing, and recent organizational changes, while operational metrics need definitions and refresh schedules to avoid misleading trends. A practical approach uses a short insight loop: theme selection, paired metrics, a narrow test, and a follow-up measurement window. If you cannot connect a metric to a mechanism, the organization should treat the finding as descriptive rather than action-driving.
For governance, the safest pattern uses aggregated reporting and documented purposes, especially when monitoring tools exist. When compliance teams review data practices early, leaders avoid later rework and employee trust issues. This is less glamorous than dashboards, but it keeps the analysis credible.
Key Takeaways
- Pair engagement survey themes with one operational proxy tied to the same mechanism.
- Track participation rate, minimum sample sizes, and timing context to prevent false signals.
- Test narrow interventions and measure again after realistic windows (weeks for operational proxies, one survey cycle for perceptions).
- Report aggregated results and document privacy and compliance practices before using monitoring data.
- Write action plans that name the hypothesis, the metric to move, and the measurement date.