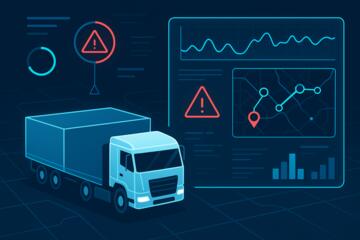
Warehouse Robotics Coordination
Warehouse robotics and AI coordination refers to the control logic that decides where mobile robots move, how they share space, and how they respond to changing orders and obstacles. In practice, coordination spans multiple layers: the warehouse management system (WMS) that knows what to pick, the warehouse control system (WCS) that translates tasks into robot commands, and the robot fleet manager that assigns routes and resolves conflicts. A typical example is a goods-to-person workflow where robots bring totes to pick stations while the WMS updates pick status in near real time.
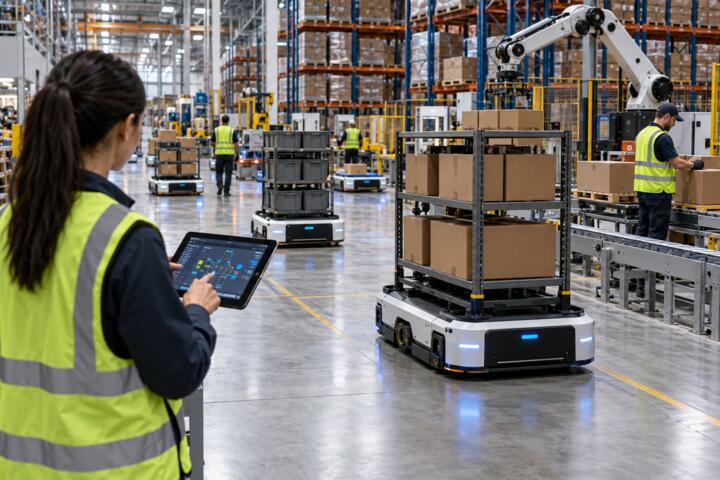
Coordination also depends on sensing and localization. Robots usually combine wheel odometry with lidar or vision-based perception, then correct drift using fixed beacons, QR codes, or map-based localization. When the floor layout changes, when pallets are stacked differently, or when lighting shifts affect cameras, the coordination layer may need recalibration or conservative routing—sometimes without any visible warning to operators.
Main Problems And Pain Points
Teams often treat “AI coordination” as a single algorithm, then discover the bottleneck sits elsewhere. A fleet manager can schedule well while the WMS feeds tasks late, while barcode scanners miss labels, or while pick stations block robot arrival lanes. Another frequent failure mode is assuming that robot navigation accuracy stays constant across shifts; dust on lidar windows, worn tires, and minor floor repairs can change localization quality.
Supporting technologies create hidden dependencies. If the network drops between the WCS and robots, task assignment stalls and robots may enter safe-stop states. If the system uses a shared map, the map version matters; a layout update without a matching map update can cause “ghost obstacles” or route detours. I once saw a fleet manager version 3.2.1 behave differently after a patch that changed how it handled dynamic congestion, and the operators blamed the robots instead of the coordination policy.
People also misread performance metrics. Throughput is not the same as robot utilization, and utilization is not the same as cycle time. A fleet can look busy while picks wait at stations, and a routing policy can reduce travel distance while increasing queue time at constrained aisles. When you evaluate coordination, you need to track the full chain: order release timing, travel time, station dwell time, and the rate of task retries due to perception or scanning failures.
Solutions And Advice
Start With System Boundaries
Write down which system owns each decision: WMS for task creation and inventory state, WCS for translating tasks into robot actions, and the fleet manager for route assignment and conflict resolution. Then list the data contracts between them: event types, timestamps, and what “task complete” means. If your integration uses message queues, confirm retry behavior and dead-letter handling; otherwise a single malformed event can silently freeze assignments.
For a practical target, aim to measure end-to-end latency from “order released” to “robot task accepted.” Many deployments can reach sub-minute acceptance in stable conditions, but the number depends on network latency, task batching, and how quickly the WMS publishes inventory changes. If you cannot measure this latency, you cannot tell whether coordination logic or upstream data is the limiting factor.
Design For Congestion And Safety
Coordination must handle shared space without unsafe behavior. Most fleets use a combination of traffic rules (lane reservations, right-of-way policies), speed limits near intersections, and safety zones enforced by sensors and safety controllers. The AI layer usually chooses routes and schedules, while safety systems enforce hard constraints such as emergency stops and protected stop zones.
Test congestion scenarios on a schedule, not only during commissioning. Create controlled experiments where you temporarily increase order volume, block a lane with a movable barrier, or simulate a robot failure by pausing one unit. Track how quickly the fleet manager reroutes and how often robots deadlock at chokepoints. A mild frustration is common here: vendors may show smooth demos, but your aisle geometry and pick-station layout decide whether rerouting works under real constraints.
Use Data Quality Checks
Perception and scanning errors often masquerade as “coordination intelligence” problems. Add checks for label readability, tote presence detection, and localization confidence. If the system reports a localization confidence score, log it and correlate low-confidence periods with route changes and task retries. For barcode scanning, track the read rate per station and per shift; a small drop can cascade into robot rework and station congestion.
Operationally, set thresholds that trigger human review. For example, if a station’s scan success rate drops below a chosen baseline for more than a defined time window, route new tasks to alternate stations or slow down task release. I have seen teams ignore scan-rate drift for weeks, then spend days chasing “mysterious” robot delays that were really label quality and lighting issues.
Plan Rollouts With Measured Gates
Roll out coordination changes through staged deployments: start with one zone, then expand to additional aisles, then increase order volume. Use measured gates such as “no increase in collision-avoidance stops,” “no rise in task retries,” and “cycle time stays within a defined band.” Keep a rollback plan that reverts to the previous routing policy or map version.
Version control matters for both software and maps. If you update robot firmware, record the firmware build date and the fleet manager version, then compare metrics before and after. A small aside from a typical change log: a map update on 2026-03-14 that moved a docking marker by a few centimeters can change docking success rates even when the overall layout looks the same.
Case Examples For Evaluation
Example 1: Congestion At Aisle Intersections
A mid-sized distribution center deployed mobile robots for tote delivery to pick faces. After go-live, pickers reported delays during peak waves, while robot utilization remained high. Logs showed that the fleet manager routed many robots through the same intersection to minimize travel distance, which increased queue time at the station entrance. The team adjusted the coordination policy to reserve intersection segments for shorter time windows and introduced lane-specific congestion penalties. After the change, average station dwell time decreased, and task retries due to missed docking events dropped because robots arrived with more predictable timing.
Example 2: Map Drift After Floor Repairs
A warehouse performed floor repairs near a high-traffic corridor and repainted lane markings. The robots continued to localize, but localization confidence fell during certain lighting conditions, and rerouting increased. The WCS still used the older map, so route planning assumed obstacle positions that no longer matched the floor. The fix involved updating the map and revalidating localization using the same procedure used during commissioning, then tightening the confidence threshold for entering narrow aisles. The team also added a short operational checklist for future floor changes so that map updates and marker verification happen together.
Comparison Checklist For Coordination
| Decision Area | What To Ask | What Good Looks Like | What To Watch For |
|---|---|---|---|
| Task Flow | How does WMS publish tasks and how does WCS acknowledge them? | Clear event types, timestamps, and retry rules; measurable acceptance latency. | Silent failures, missing acknowledgements, unclear “task complete” definitions. |
| Routing Policy | How does the fleet manager handle congestion and chokepoints? | Congestion-aware routing with lane reservations and rerouting under blocked lanes. | Distance-only optimization that increases queue time at stations. |
| Localization | What sensors correct drift and how is confidence reported? | Confidence metrics logged; procedures for map updates and marker verification. | Map mismatch after floor changes; low-confidence periods ignored. |
| Safety Boundaries | Which parts enforce safety limits versus which parts plan routes? | Safety controllers enforce hard constraints; coordination respects safety zones. | Assuming “AI” replaces safety logic; unclear emergency stop behavior. |
Step-by-step checklist you can run during evaluation:
- Measure baseline: order release to robot acceptance, travel time, station dwell time, and task retry rate.
- Run a blocked-lane test: block one corridor segment and record reroute time and stop events.
- Run a scanning test: degrade label readability slightly and measure how quickly the system recovers.
- Run a localization test: simulate low confidence by changing lighting or using a controlled marker mismatch.
- Review logs with the vendor: confirm which component generated each event and how retries are handled.
- Define gates for rollout: cycle time band, retry-rate ceiling, and acceptable stop-event frequency.
Common Mistakes
Teams often optimize for robot travel distance while ignoring station constraints. If pick faces have limited buffer space, shorter robot routes can still create longer queues at the station entrance. Another mistake is treating retries as a minor nuisance; repeated docking failures can consume robot time and increase congestion, which then increases the chance of further failures.
Integration mistakes also appear frequently. A common issue is inconsistent time zones or timestamp formats between WMS and robot logs, which makes it look like coordination is slow when the real delay sits in event ordering. Another recurring problem is missing map version tracking; operators may update a map for one zone while the fleet manager still uses an older version for route planning.
People also over-trust dashboards that show “utilization” without showing task completion distribution. A robot fleet can show high utilization while a small fraction of tasks fail repeatedly, dragging down throughput. If the system reports task failure reasons, require a breakdown by cause such as localization confidence, docking alignment, or scan mismatch, then tie those causes to operational fixes.
FAQ
What data does coordination need?
Coordination typically needs task assignments from the WMS, robot status and localization data from the robots, and a shared representation of the floor layout used for routing. The exact fields vary by vendor, so request a sample event log and a data dictionary for the integration.
How do robots avoid collisions?
Collision avoidance usually combines safety controllers with sensor-based detection and predefined safety zones. The coordination layer plans routes, but safety logic enforces hard constraints such as emergency stops and protected stop areas.
What metrics show coordination health?
Use end-to-end acceptance latency, travel time distribution, station dwell time, task retry rate, and the rate of safety stops or protected stops. Track failure reasons so you can separate routing issues from perception or scanning issues.
How often should maps be updated?
Update maps when physical layout changes, when docking markers move, or after floor repairs that affect localization. Many teams also schedule periodic revalidation runs, because wear and lighting changes can reduce localization confidence even without visible layout changes.
Can AI coordination work with older WMS systems?
It can, but integration quality determines outcomes. The key requirements are reliable task event publishing, consistent inventory state updates, and clear acknowledgment and retry behavior between WMS and the WCS/fleet manager.
Author's Insight
Warehouse robotics coordination succeeds when the system treats routing, sensing, and inventory state as one measurable chain rather than separate projects. The most actionable evaluation approach is to instrument the full path from order release to task completion and then run controlled stress tests that mirror your real constraints. Coordination policies often fail at chokepoints, so aisle geometry and station buffering deserve the same attention as the fleet manager’s algorithms. When vendors discuss “AI,” request evidence in logs: reroute behavior under blocked lanes, localization confidence handling, and retry reason breakdowns.
Key Takeaways
- Coordination spans WMS, WCS, fleet management, localization, and safety logic; failures often originate outside the “AI” layer.
- Measure end-to-end latency and task retry reasons, not only robot utilization.
- Test congestion, blocked lanes, and scanning/localization stress before scaling beyond the pilot zone.
- Track map and software versions together, since floor changes and patches can alter behavior.
- Use rollout gates with rollback plans so coordination changes do not degrade throughput quietly.